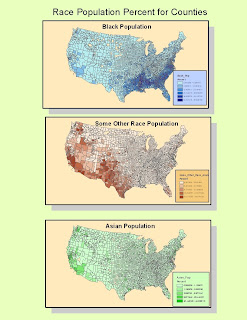
The map 'Black Population' shows that the majority of Blacks live in the south. If you zoom in closely to counties that contain major cities, many of these also have a high percentage of blacks. However, the majority of blacks still live in the "Deep South", as has been a tend for a long time. There also seems to been a semi-ubiquitous spread across the rest of the nation.
The map 'Some other Race Population' shows what is most likely the dispersion of Latinos across the Continental United States. Latinos are mainly concentrated in the southwest, including Los Angeles county. This makes sense because of the proximity of these states to Latin America. Some counties seem to be anomalies and have high Latino populations in regions where surrounding counties do not. There is not enough data to explain why this could be though.
The map 'Asian Population' shows that the majority of Asians are concentrated along the west coast, and mainly in California and Washington. The Bay Area has a few of the highest percent Asian counties in the nation (San Francisco, San Mateo, and Alameda). Asians have by far the least dispersion of the three races as they are mainly concentrated in a certain area, and mostly absent in other parts of the country excluding major cities.
I think the census map data is really interesting because I think population statistics on race, wealth, age, and other features are very interesting. It can lead to a lot of interesting questions about why things are the way the are. In respects to GIS, I've really enjoyed the labs in this class. I think ArcGIS is a great program, and I think the maps that it can create are fun, interesting, and can also be extremely useful in analyzing a problem.